By Rod Smith, Blower & Vacuum Best Practices
01/25/2012
Blower & Vacuum Best Practices interviewed Gregory Rhames, Asset Reliability Manager/Energy Manager at Verallia.
Good afternoon. Please describe Verallia’s operations here in Madera, California.
Good afternoon. As background, Verallia is the packaging division of Saint-Gobain. Verallia employs 15,500 people globally and makes about 25 billion glass bottles and jars each year. We employ 350 people at Madera where we produce about 1 million wine, champagne and sake bottles per day. Our company is dedicated to energy efficiency and maintaining a sustainable global habitat. We are very proud to say that we are the only glass container company to win the EPA ENERGY STAR® Partner of the Year and Sustained Excellence awards. Verallia is also the only glass container company to have ENERGY STAR® rated plants.
We characterize our plant as having two distinct parts, a “hot end” and a “cold end”. In what we call the “hot end” of the plant, we have furnaces that melt the raw materials and recycled glass. The glass is manufactured into containers with bottle making machines that use high volumes of compressed air at roughly 50 psi. Molten glass is shaped into bottles using molds to capture the shape while being blown by compressed air. Once the bottles are formed, they are annealed in temperature-controlled kilns.
In the “cold end” of the plant, we finish the production process with machinery that separates, inspects, conveys and packages the bottles into cases and then sends them out to be palletized. Much of the equipment in the “cold end” of the plant utilizes 90 psi compressed air to run all the cylinders, actuators, and blow-off functions of these machines.
How is energy managed in the Madera plant? What was the energy spend and how is it split up?
Energy is a significant part of our production costs. It’s a pretty equal split between natural gas and electricity.
I am the site Energy Manager and am directly responsible for all non-furnace energy consumption. I do have input on trying to reduce the energy consumption of the furnace. I’m also the Asset Reliability Manager at the plant. The primary aspect of this function is that I’m in charge of the Preventative Maintenance Program and am in charge of process improvements. It’s about a 50/50 split of my time. I report to our plant manager and am closely linked to the Saint-Gobain energy management team. This team, led by Brad Runda, has provided us with invaluable support and resources to discover and implement energy efficiency projects. Many excellent compressed air efficiency resources and ideas have come from this team.
Some of my initial projects included the use of VFD’s to reduce the kW used on some cooling tower pumps and fans. We also did some lighting projects where I replaced high energy-intensity lighting fixtures with low energy-intensity fixtures.
However, compressed air is a big opportunity and is one of my primary focuses. Having made several comparisons of similar systems within the company, I decided to concentrate my attention on the end uses (demand side) in the system.
What have the financial results of your compressed air efficiency efforts been?
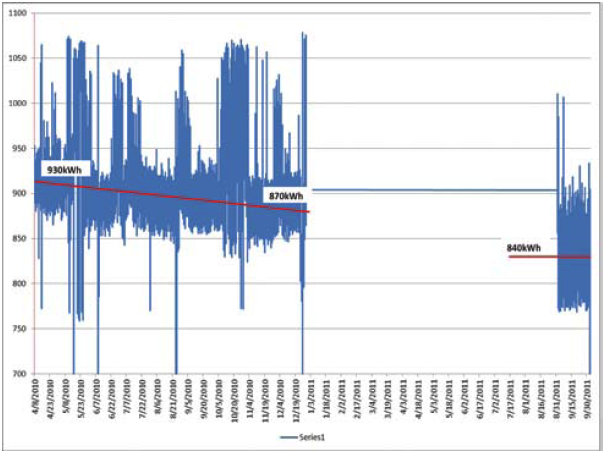
When doing demand-side projects, it’s critical to measure the supply-side of your system to ensure that the air compressors are actually consuming less energy. An independent engineering firm is contracted by Pacific Gas and Electric Co. to verify the energy savings, by performing data-logging on our air compressors, and to ensure that we “maintain the gain”. In April 2010, our air compressor power demand for the 90 psi system averaged 930 kW. By implementing good practices, by the end of 2010, our average demand was 870 kW and by October of 2011 we averaged 840 kW. When multiplying our energy savings by our electricity rate, we’ve seen an annual savings in the neighborhood of $100,000.00 resulting from the 90 psi system reductions. We have fairly new air compressors and a supply-side compressed air system able to capitalize on our demand reductions. Part of the air leak projects, called retrocommisioning, relies on the collection of data achieved from the air waste reduction efforts. These records establish the initial baseline of each piece of equipment, and the final established best case CFM after repairs and upgrades. This new lower baseline then becomes the monitored acceptable equipment CFM level. The independent engineering firm uses this data to quantify the incentive amount from our local utility. Our current utility RCX program incentives pay for a portion of the material and labor to do these projects
So you started with setting up a compressed air flow measurement system?
Correct. I like to say, “Measure What You Treasure”. Our first step was to set up a measurement system designed to tell me whether or not we were doing anything “useful” – at each end use machine. When researching metering options, we found that CDI Meters provided a good flow measurement product that was economically suitable for my purposes. It was simple to install so it provided quick and accurate flow measurements from the digital readout. It is what I was looking for to achieve my goal of measuring how much compressed air flow each machine used.
We placed our first flow meter on a case erector which is a high demand air user in the “cold end” of the facility. The newly installed meter indicated that the machine was using 80 CFM – when it was at idle! This immediately told us that this machine represented a significant air leak reduction opportunity. Each time we fixed a leak, the flow meter would confirm a reduction in idle compressed air CFM consumption.
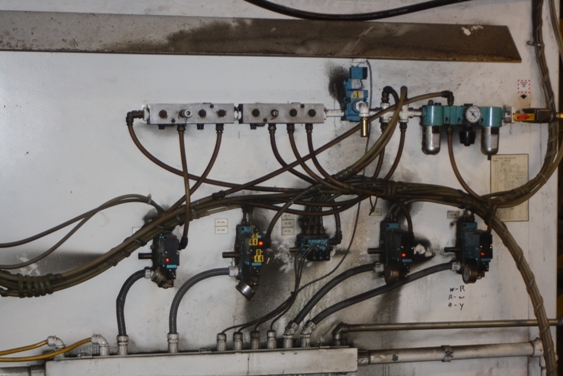
This flow measurement system worked so well that we created a single measurement and data collection point for all the case erector machines. Power and data leads from each flow meter come back to the box-mounted digital displays. We put a portable data logger inside the box to record the data at preset intervals. The measurement instruments and data loggers proved to be a great combination.
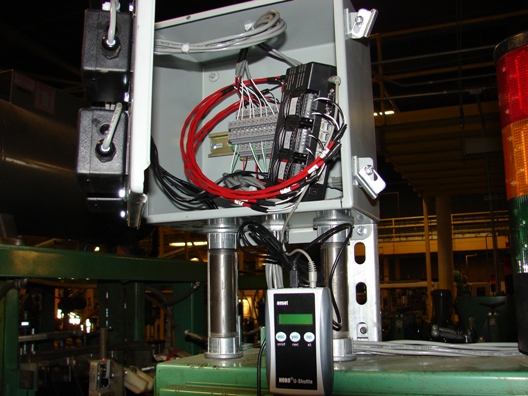
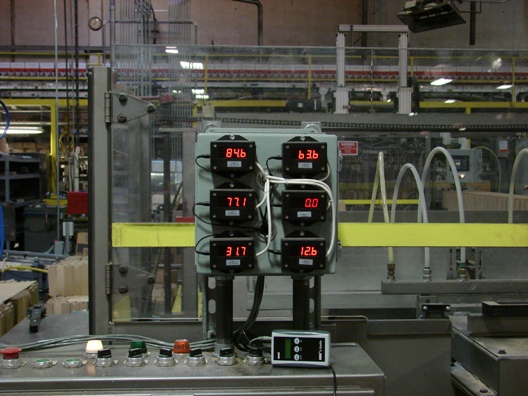
Compressed air flow meters are used on each case erector and flow is displayed and data-logged at a centralized location.
How did you identify the compressed air leaks on the case erector?
The “hot end” of the plant primarily uses low-pressure compressed air and consumes the largest portion of the compressed air we produce. Because of the large demand, it seemed like the logical place to start, but it is a hot and noisy environment making it difficult to find air leaks. Our maintenance staff did find a couple of large leaks that they fixed, but we decided to concentrate on the high pressure system in the cold end where the environment was more suitable for developing our system for measuring and evaluating improvements.
We focused our efforts in the “cold end” of the facility and on the case erectors. We knew that we had eight (8) case erector machines consuming 80 CFM when idle. After installing CFM meters, we immediately repaired the air leaks we could hear on the machine. Most were located on pneumatic components inside the machine. This included changing out fittings, leaky regulators, and valves inside the machine. We also used an ultrasonic leak detector to find and fix smaller and harder-to-hear leaks on the pneumatic circuits.
Our lead man in the box shop identified two valves porting vacuum or high-pressure (90 psi) air to the vacuum cups on each case erector. These aren’t leaks per-se, but waste designed into the equipment by the vendor. The vacuum cups are used to grab a case to form it or to release the case and move it on to the next station. The two-position valves were wide open, most of the time, and blowing off compressed air continuously through a ¼ inch port when not in the vacuum position. The only time the valve was in the vacuum position was when the cup was going to pull an unfolded case out of the magazine.
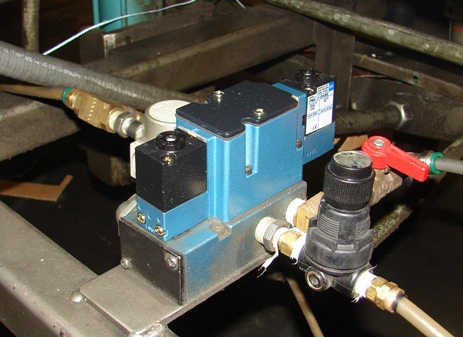
BEFORE: Two 2-position valves consumed 80 cfm when the case packer was idle
AFTER: The new 3-position Numatics valves reduced consumption to 15 cfm
We identified a 3-position Numatics valve with a closed center. The valve shifts to the high-pressure 90 psi compressed air for ½ second to release the case and then goes to the center closed position. When we replaced the first valve, idle air flow dropped to 45 CFM. We then replaced the second valve and idle CFM dropped to 15 CFM. Using the 3-position valve reduced our idle CFM from 80 to 15 CFM. The energy cost reduction from one machine exceeded the cost for the equipment to outfit all 8 case erectors identically.
We then replicated this success on the seven other case erector machines. A key point here is that without the use of the flow meters, we wouldn’t have had the information to manage or understand the relative impact we could have on the flow used by the case erectors.
What are the keys to a successful leak management program?
The keys are having the ability to measure whatever you are attempting to control, a strong pneumatics partner, and program ownership in the hands of plant maintenance. I have spent more than twenty (20) years in maintenance. We like to say that until you are at the four foot level, nothing gets done. You have to touch it, feel it, and do it. That is where and when you really find the big energy wasters.
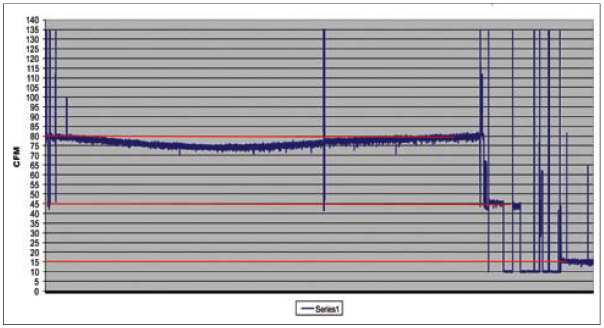
We use the flow meters to establish and maintain the “Best Practice” flow for each machine. A good example is provided by machines used in our palletizing process. We set one up with a flow meter and found it used 75 CFM of 90 psi compressed air at idle. We then got to work optimizing the machine. Industrial Automation Group assisted with the integration of the new valve assemblies. We made a conscious decision to convert to Numatics equipment to reduce maintenance. They have no O-rings and are a matched set with an air seal that is a precision fit. Further, we like the fact that their duty cycle is in the millions (not thousands).
Changing the first valve assembly reduced our idle air flow consumption by 33 CFM from 75 to 42 CFM. A few days later we changed the second valve assembly and reduced it further to 23 CFM – which became our “Best Practice” flow rating for the palletizing equipment.
Just as important, our load center operators saw that the machine worked better with the new pneumatic circuits and began monitoring the flow rating on the machine. At one point after the meters and valve assemblies were installed, they reported observing a gradual rise in the flow readings on one of the flow meters. During our data logger rounds we confirmed that flow had increased to 36 CFM. We simply called our maintenance mechanic to see what was happening. It took forty minutes but he found a cylinder that was blowing out compressed air in a hard-to-see location inside the cabinetry of the machine. He replaced the cylinder and the flow returned to 23 CFM. In the past, we probably could have operated for a long time completely unaware of this air leak. This explains why metering is so critical
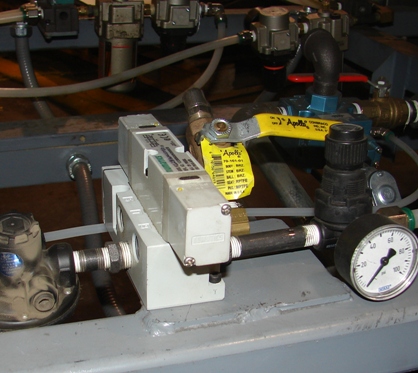
BEFORE: Pneumatic circuit on the load center machine consuming 75 cfm at idle.
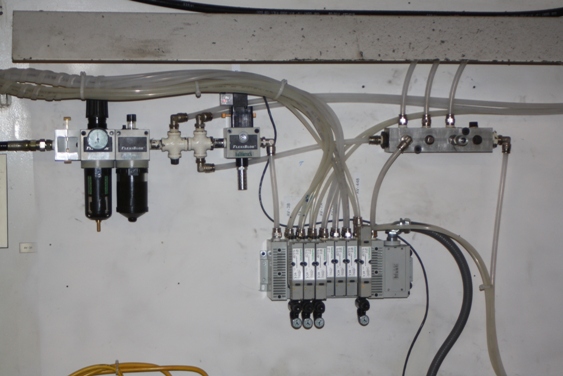
AFTER: Pneumatic circuit on the load center machine consuming the “Best Practice” 23 cfm at idle.
What are your next steps and goals?
We are continuing to measure flow baselines for any new machine and all our existing machines. When we get a new machine, we find leaks and have to do repairs on the pneumatics. We then establish the “Best Practice” flow baseline. We are working on a Plant Wide Monitoring system and automating the collection and management of data.
We are also working to improve our specifications and standards for new equipment. Equipment should arrive optimized for energy efficiency and with an air, gas, or water meter on it. Electrical panels should arrive with CT’s and meters pre-wired in so we can hook up a communication cable enabling us to look at voltage, amperage, kWh and phase balancing. Every plant needs to lower their energy costs and our equipment suppliers need to be involved with that.
Thank you for your insights.
For more information, contact Rod Smith at Blower & Vacuum Best Practices.
For similar articles interviewing Energy Managers, please click here.