By Tom Jenkins, JenTech, Inc.
03/17/2020
An important part of developing the design for any project is determining its cost effectiveness. In most cases there are several design options considered. Deciding which option is best includes evaluating the life cycle cost of each.
Aeration blower upgrades may be part of a total plant upgrade and minimizing energy consumption is a critical consideration. Blower replacements are also a common Energy Conservation Measure (ECM) in cost-reduction programs.
Regardless of the reasons for blower and aeration system replacement, the designer faces challenges in determining the cost effectiveness of the design. Process demands and energy costs are complex and variable. Moreover, several methods for calculating cost effectiveness are available.
Examining Actual Blower Power Cost
Aeration blowers are almost always driven by electric motors and determining the cost of electric energy is the first challenge. This seems like a simple task, but the outward simplicity may be deceptive.
Many analyses use the average cost of electricity. This is also known as the composite rate. It is simple to determine. The designer simply divides the total monthly electric bill by the total energy used. The result is a composite of the many factors that go into actual costs for electricity as shown in Table 1.
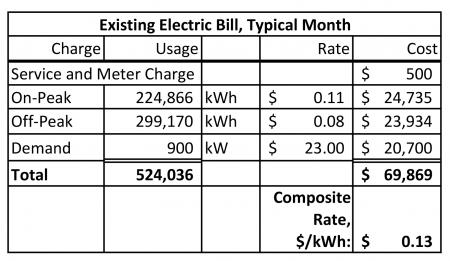
Table 1. Sample Electric Charges
The average annual expense can be calculated as follows:
Total$/Year=kW ave ∙ 8760 hours ⁄ year ∙Average $ ⁄ kWh
The national average composite rate for industrial users is $0.07/kWh.
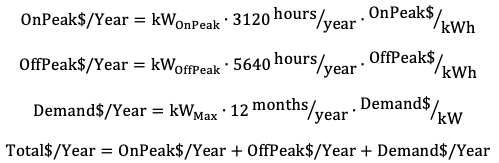
Large users, such as a water resource recovery facility, typically have a complex billing structure based on the utility’s cost to generate and distribute power. The variables include time of day, day of the week, and rate of usage. Power used during the day on weekdays is more expensive than power used at night or on weekends. In addition to usage charges, most utilities also impose demand charges based on the peak power draw during a month or year using a fifteen-minute running average. Using actual time-based billing rates will provide a more accurate power cost than the composite rate. The calculation is as follows:
Factor in Blower Duty Cycle
Establishing rates for electricity only provides half the data needed. In order to evaluate blower operating costs, the load profile, or duty cycle, needs to be established. Ideally the duty cycle of the blowers matches the process demand of the aeration basins.
Actual process loads rarely match design assumptions. Actual or near-term average daily flow is typically lower than the projected design load. Seasonal variations are significant for some facilities, and side streams can create additional loading.
The dominant factor in process loading and blower duty cycle is the diurnal fluctuation. (See Figure 1.) The peak load is typically twice the minimum. The loads corresponding to utility billing times can be derived from the diurnal flow pattern.
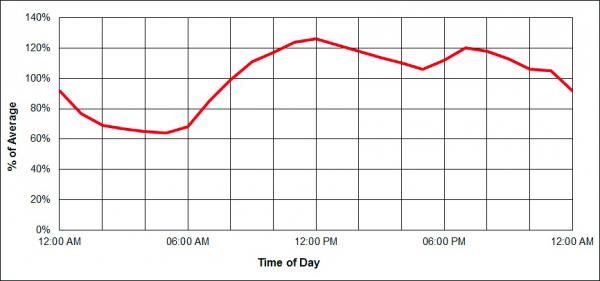
Figure 1. Typical Diurnal Loading Pattern
Since airflow and blower kW are essentially proportional to hydraulic loading the duty cycle can be established as a function of average kW.
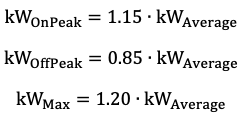
The typical municipal facility’s diurnal variation can be modeled using five different flow rates. (See Figure 2 and Table 2.) This model can be used to calculate the blower duty cycle and determine a weighted average airflow and blower power. Note this model is based on average dry weather loading. Storm events and internal slugs are short-term loads and may be ignored in total energy determinations.
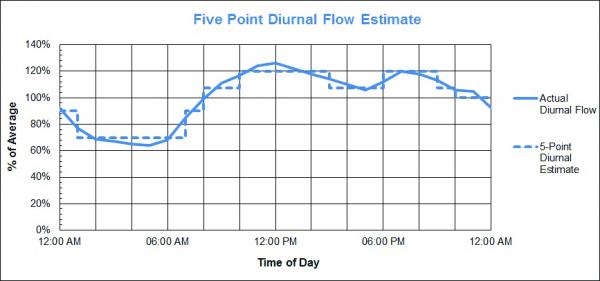
Figure 2. Five-point Diurnal Flow Model
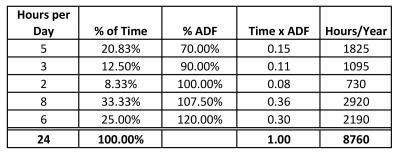
Table 2. Diurnal Load Variation
The values in Table 2 can be used to determine the average power consumption over the course of typical diurnal variations. The technique is best illustrated with an example. Performance data for proposed new blowers with a design capacity of 11,000 scfm at 8.5 psig is shown in Table 3. The proposed system will employ Most-Open-Valve (MOV) logic so discharge pressure will vary with the airflow rate. The projected average total airflow is 14,000 scfm at 7.75 psig. Similar data for the existing blowers, which operate at constant 8.0 psig discharge, is shown in Table 4. Applying the factors in Table 2 the average kW is calculated for the new system and existing systems.
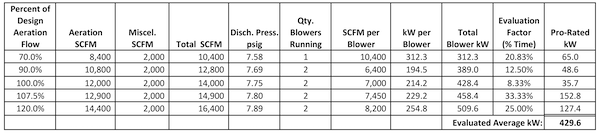
Table 3. Example Diurnal Evaluation for New Blowers
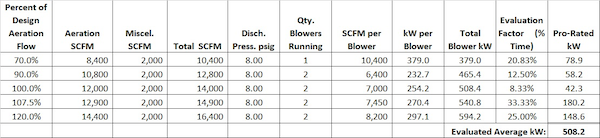
Table 4. Example Diurnal Evaluation for Existing Blowers
Evaluating Blower Life Cycle Cost
There are many methods available for evaluating the life cycle costs of blower systems. The data needed for all of them is similar. Fixed costs, or capital expense (CAPEX), includes equipment and installation. Salvage value and utility incentives should be deducted from the CAPEX. Recurring costs, or operating expense (OPEX) identifies the annual cost of operation. This includes energy cost based on duty cycle and utility rates. OPEX also includes labor for routine maintenance and an allowance for repairs. Life cycle cost is COPEX plus accumulated OPEX over the life of the system. Some methods also consider interest on loans and inflation.
The two most common methods for comparing cost effectiveness of alternate designs are simple payback and present worth. If the system life is short there is little difference in the conclusion from either method.
Simple payback calculates the time it takes for OPEX savings to offset differences in CAPEX investment. This method is intuitive and requires few assumptions:
![]()
Present worth analysis is more complicated than simple payback. It includes the impact of inflation and the cost of money (interest expense) in the comparison. Both the interest rate and the inflation rate should be expressed as decimals. Because interest and inflation are assumptions the result may not be more meaningful than simple payback results, even though the calculation itself is more sophisticated.
The net present worth is the difference between OPEX savings corrected for interest and inflation and the difference in CAPEX. The net present worth will be greater than zero if the project is justified.
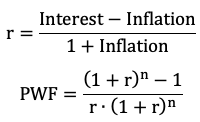
Where:
PWF = Present Worth Factor
n = years of system life
Net Present Worth=PWF∙OPEX Savings-CAPEX Difference
Regardless of the method chosen for the analysis the designer should keep in mind there are assumptions involved. The number of significant digits used in the calculations should reflect this fact.
Example Operating Cost Analysis
An analysis of replacing existing blowers as shown in Table 4 with new machines as shown in Table 3 illustrates the factors and options for accurately determining costs.
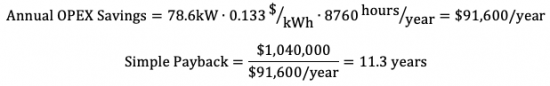
The combined equipment and installation cost for two new blowers and MOV control is estimated at $1.04 million. There is no CAPEX for the existing blowers. The electricity rate structure and the duty cycle are shown in Table 1 and Table 2. A twenty-year equipment life is assumed. The difference in average power consumption is 508.2 kW minus 429.6 kW = 78.6 kW. Maintenance and repair costs are assumed equal for both systems.
There are four variations presented above to consider:
- Simple payback using composite power cost.
- Simple payback using time of day power cost.
- Present worth using composite power cost.
- Present worth using time of day power cost.
The simple payback with composite power rate:
CAPEX Difference=$1,040,000
If time-of-day power rates are used the annual OPEX savings is:
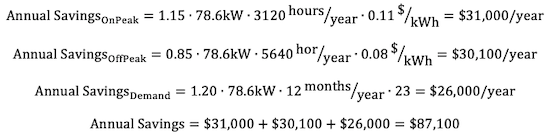
The annual savings calculated using time-of-day billing is lower than the savings using the composite rate, and the payback is:
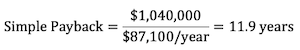
The payback period is less than equipment life for both methods.
Using the present worth method requires two additional assumptions. The assumed interest rate is 5% and the assumed inflation rate is 2%.
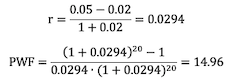
The present worth factor reflects the fact that a dollar today is more valuable than a dollar in the future. The net present worth is calculated using average power and the composite electricity cost:
Net Present Worth=14.96∙$91,600-$1,040,000=$330,000
With actual time of day electricity cost:
Net Present Worth=14.96∙$87,100-$1,040,000=$263,000
The net present worth is positive. The project could be economically justified by any of the analysis methods.
Engineering judgement and owner situations must be included in the design decision. For example, if the owner has limited bonding capacity available the low present worth of the investment may not justify depleting the available capacity. The payback period exceeds eleven years, which is typically two permit renewals. If process changes are anticipated the anticipated savings may not be realized. On the other hand, utility incentives may be available for energy conservation measures, reducing CAPEX and improving the economics.
Strive for Accuracy
The determination of life cycle cost is essential in the design process. This is particularly true for projects where energy conservation is the primary interest. Unfortunately, the life cycle cost calculations can be intimidating.
The designer has several options for determining the cost effectiveness of alternate systems. The method selected should be based on the data available and the designer’s confidence level in the assumptions.
It is important to remember these calculations are not exact. The designer should strive to obtain a reasonable level of accuracy based on the data available while recognizing the limitations of the analysis. Increasing detail in the analysis may not result in increased reliability for the conclusions.
For more information contact Tom Jenkins, President, JenTech Inc., email: info@jentechinc.com, or visit http://www.jentechinc.com/. Mr. Jenkins has texts now available in hardcopy and electronic versions titled Aeration Control System Design https://www.wiley.com/en-us/Aeration+Control+System+Design%3A+A+Practical+Guide+to+Energy+and+Process+Optimization-p-9781118389980 and Introduction to Water Resource Recovery Facility Design https://news.wef.org/wef-book-provides-water-resource-recovery-facility-design-information/.
To read similar articles on Aeration Blower Technology, please visit https://blowervacuumbestpractices.com/technology/aeration-blowers.