In open end pipe line suspension flow, or dilute phase pneumatic conveying, proper particle velocity is critical to continuing productivity and product quality. Until recently, measurement of actual particle velocity within the pipe has not been practical outside the laboratory. The plant operating personnel depend on a much less accurate metric - estimating the conveying air velocity in the pipe and relating that to particle velocity.
The objective of this article will not be how to design or engineer a well-operating dilute phase conveying system, but rather to bring awareness of the importance of knowing the proper particle velocity - to achieve optimum productivity and quality. Identifying the actual particle velocity has always been somewhat of an art form rather than a technical accuracy. Most commonly, pipe line air velocity is calculated based on perceived or measured flow, actual or estimated pressure along the route, and then operated accordingly.
Accurate, non-invasive, particle velocity measurement devices are now available at reasonable cost that can monitor and control actual particle velocity at selected points in the pipe line. This brings a significant tool to plant operating personnel to identify and develop the proper operating conveying air velocity and particle velocity profile, even as variables may modify the requirements over time.
Figure 1. Common Materials Associated with Open Pipe/Suspension Pneumatic Conveying, and the Importance of Particle Velocity Control
|
Abrasives |
Sand, Glass, Aluminum, Mineral Filled Pellets, Cement, Bauxites, Coal, Grains, Sugar, Carbon Black, Fly Ash, Cereal, and Starch, all cause significant pipe and elbow wear by too high particle velocity * |
* Too low of velocity, particularly in horizontal pipe, will allow fall out of particles from the conveying air into the pipe, often leading to plugging and other issues. |
|
Pelletized Resins |
Friction at the pipe causes surface deterioration by too high particle velocity * |
|
|
Friable Materials |
Pet food, Coffee Beans, Grains, and Cereal, all susceptible to breakage and dusting from too high particle velocity * |
|
|
Heat Sensitive Material |
Sugar, Rubber Pellets, Clay, Hot Melt and Adhesives Wearing against the pipe and elbow walls, creates friction, heat, product build up and plugging from too high particle velocity * |
Conveying Air Velocity Measurement Formula
Conveying Air Velocity is a critical metric in pneumatic conveying and is easily measured and/or calculated with the proper data, including actual flow in inlet scfm (Nm3/h), and actual pipe line pressure in psig/BAR. The basic formula for pipe line velocity is:
Air flow in Inlet scfm ÷ the area of the pipe in sq ft ÷ compression ratios of the air in the pipe = fpm
Example:
Using an entry pressure of 15 psig to the pipe and a blower flow rate of about 1,176 scfm in a 6” pipe (area .196 sq ft) will deliver a conveying air velocity of 3,000 fpm.
Figure 2. Air Flow and Pipe Line Velocity
|
Nominal Pipe Diameter in Inches |
Pipe Area (Square Feet) |
Velocities of Air in Pipe (Feet/Minute) |
|||
|
2000 |
2500 |
3000 |
3500 |
||
|
SCFM required to meet velocity at 15 psig (29.5 psi) |
|||||
|
3/4" |
0.0034 |
13.6 |
17.0 |
20.4 |
23.8 |
|
1” |
0.0054 |
21.6 |
27 |
32.4 |
37.8 |
|
1 1/4" |
0.00974 |
38.9 |
48.7 |
58.4 |
68.2 |
|
1 1/2" |
0.01342 |
53.7 |
67.1 |
80.5 |
93.9 |
|
2” |
0.02185 |
87.4 |
109.25 |
131.1 |
152.9 |
|
2 1/2" |
0.03734 |
149.4 |
186.7 |
224.1 |
261.68 |
|
3” |
0.049 |
196 |
245 |
294 |
343 |
|
4” |
0.087 |
348 |
435 |
522 |
609 |
|
5” |
0.136 |
544 |
680 |
816 |
952 |
|
6” |
0.196 |
784 |
980 |
1176 |
1372 |
|
8” |
0.349 |
1396 |
1745 |
2097 |
2443 |
Selecting the Air Volume Required
There are some very accurate guidelines to follow when applying compressed air to move material in an open tube or pipe.
- Entry pressure should be 6 to 15 psig entry and at or near atmospheric pressure at the end of the run. To calculate the required volume (scfm) of flow to achieve the desired velocity, use 15 psig (29.5 psia or about 2 ratios) to determine the air flow needed.
- Velocities above 2,000 fpm (33 fps) will keep a great deal of material in suspension within the flowing air stream. Below this, some significant amounts may fall out and stay in the tube. Therefore, about 2,000 fpm is often the recommended minimum velocity.
- As the material to be carried within the air stream gets heavier, the velocities required will increase up to about 7,000 fpm (116 fps), after which great care must be taken that the “sandblast effect” does not harm the piping or tubing. Damage from the “sandblast effect” can start to occur anywhere from 3,000 fpm to 7,000 fpm depending on pipe line configuration, and the abrasiveness of the flowing material.
These above limits are general guidelines and not to replace the conveyor system manufacturers recommendations or test data.
Some Key Points:
- As the pressure within the pipe falls due to restrictions and/or nearing the open end, the conveying air velocity will increase. For example, if the entry conveying air velocity is 3,000 fpm at 15 psig start, and the volume stays the same, it will be 6,000 fpm at the 0 psig open end exit. Anywhere along the line when there is a pressure reduction with a fixed flow, the conveying air velocity will increase accordingly. Conversely, should the pressure start to build up in the line, the conveying air velocity will fall.
- Most engineers refer to the conveying air velocity and assume the particle velocity will somewhat lower. This difference between air velocity and particle velocity will vary with such factors as particle size, weight, shape, etc.
- Particle velocity will also be impacted by the pipe line configuration and material. At bends or elbows, the change in direction can cause the particles to impact on the walls and with each other lending to the inevitable reduction in particle velocity and possible product deterioration through particle degradation.
- Horizontal lines are usually the most critical with regard to particle velocity. The magnitude of these issues is exacerbated with any bend or change of direction.
Understanding the specific dilute phase pneumatic conveying profile is very important; identifying where particle measurement is critical. The particle velocity should be measured directly near these points, possibly along with the simultaneous conveying air velocity at the same locations.
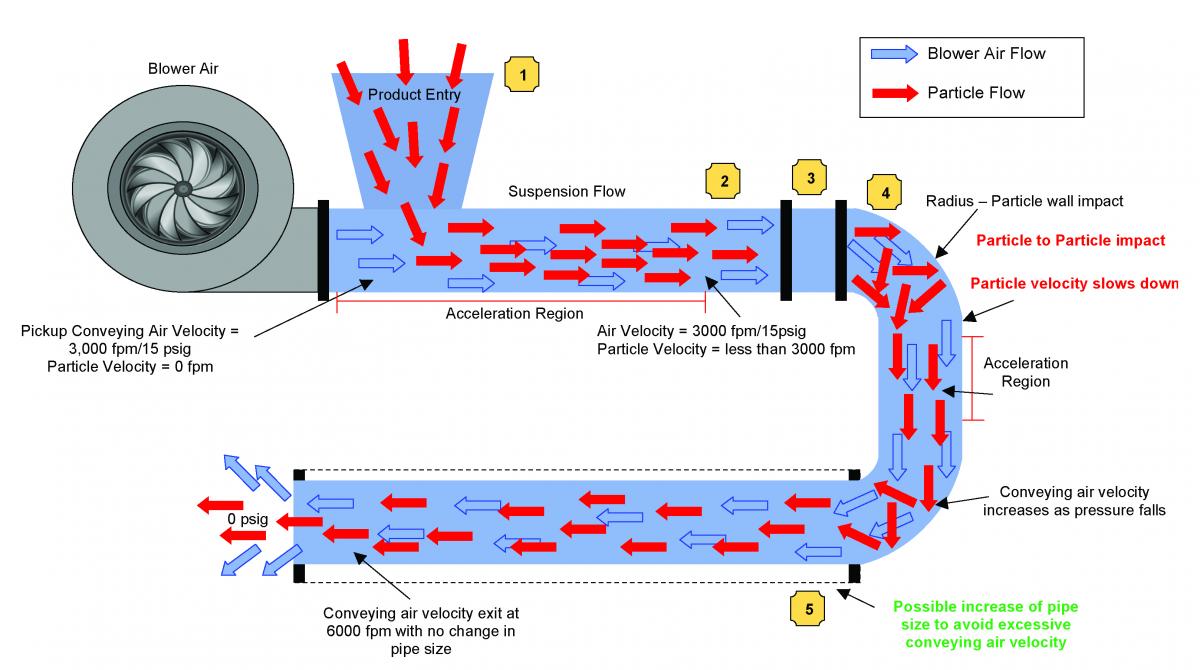
Figure 3. Basic Anatomy of Suspension Particle Flow, Open Pipe Pneumatic Conveying
Click here to enlarge
Figure 3 shows some relatively fundamental, common dilute phase system issues that may evolve in any system to illustrate this point. Knowing your conveying air and particle velocity operating profile should help keep many of these issues in the “rearview mirror”.
Conveying air from blower product pickup
At pipe line entry, the air from the blower 1,176 scfm at 15 psig into a 6” pipe is 3,000 fpm velocity; the particle velocity of the product is 0 at this point.
Acceleration area
From 1 to 2 is the acceleration area where the particle velocity has to accelerate to its terminal velocity (the maximum it can reach in the specific conveying air stream). It is very important that in this area the pipe line stays straight with no bends or elbows since it is not yet at proper particle velocity to stay in suspension and this could lend to significant product fall out.
Typical bend or elbows
From 2 to 3, the particles enter an elbow, the conveying air will probably go through the turn with much less effect on velocity than the material particles. Depending on the particle size, weight, shape, and pipe line configuration, it may impact on the side walls of the outside radius. This may be combined with some level of particle to particle impact which altogether can cause product degradation and a resultant reduction in particle velocity. If there is enough reduction and fall out in the elbow, there may be a critical acceleration area following the elbow to be identified to avoid additional issues. The ability to measure what is actually going on in the pipe on site can lead to modifications or velocity control to improve productivity and quality.
Second Bend
Same as first bend, hopefully not inside another acceleration area.
From 4 to 5 final run of pipe to exit
As the flowing conveying air stream and material flow get close to the exit, the pipe line pressure continues to fall causing a continuing increase in velocity. One popular fix for this is to “upsize” the pipe to the proper size to lower flow velocities to the proper level. Proper measurement, or conveying air and particle velocity will be very effective here.
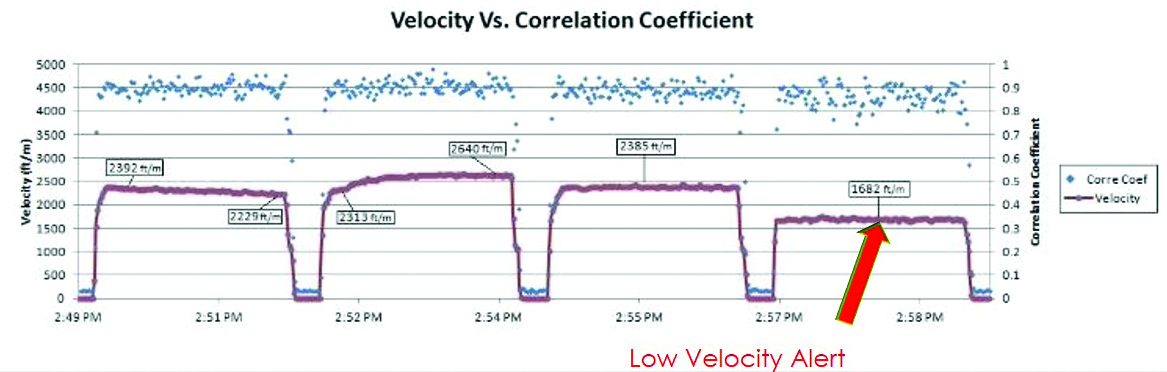
Measuring Particle Velocity Directly
Proper particle velocity measurement and control can:
- Improve productivity
- Improve product quality
- Reduce and control energy cost to optimum levels
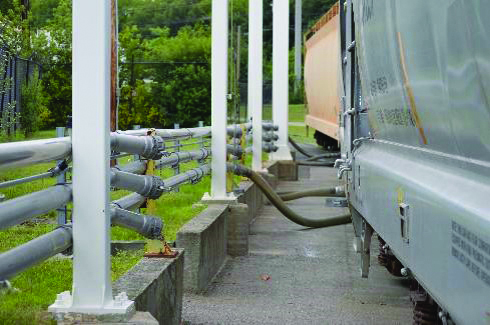
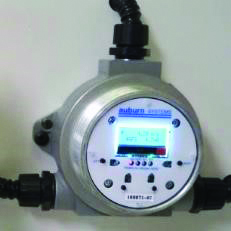
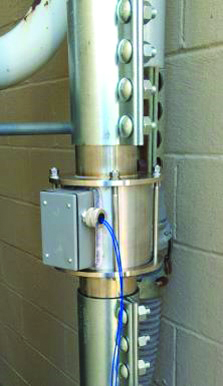
Figure 4. Velocity Monitoring, Railcar Unloading – courtesy www.auburnsys.com.
Click here to enlarge.
Conclusion
Today’s estimating particle velocity in dilute or suspension pneumatic conveying is more of an art form than an accurate measured science. The introduction of commercially available direct particle velocity measurement instruments at reasonable cost now provides plant operators an effective tool to identify and control the critical operating parameter of “actual particle velocity” under all conditions.
Too often, what we think is optimum velocity (as tested by the conveying equipment supplier), is a fixed value. For optimum performance in productivity, product quality and energy operating expense, the actual velocity must be adjustable. Consider these thoughts:
Why adjustable particle velocity?
- Product characteristics will change the optimum velocity
- Freshness of product
- Supplier
- Environmental conditions
- Incorrect blending
How can we adjust the particle velocity during operation?
- Adjust the flow as required in a timely manner reacting to the instrument signal
- Electronic flow control valve
- Apply blower between 40% and 80% of its full range
- Control flow with variable speed drive today, signal to control
- Better reaction
- More energy efficient
- Use inlet valve turndown and or blow off or both
- Apply selected, multiple blower units to fit conditions
Knowing and controlling particle velocity in a proactive manner, allows corrective action by plant operating personnel before there are negative consequences. Today’s modern, non-invasive, continual particle velocity monitoring and control instruments can be a major part of this program.
For more information contact Hank van Ormer [email protected].
To read similar articles on Pneumatic Conveying Technology visit /technology/conveying.