Introduction
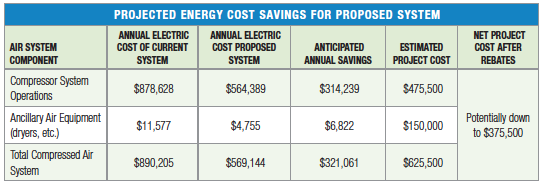
This factory, located in the U.S. northeast, spent an estimated \$890,205 annually on energy to operate the compressed air system. The group of projects recommended below reduced these energy costs by \$321,000 or 36% of current use. These estimates are based upon a blended electric rate of \$0.118/kWh.
Estimated costs for completing the recommended projects total \$625,500 – providing a simple payback period of 48 months. This does not take into account the real possibility of energy incentives of up to \$250,000 being awarded to this project. Due to article length constraints, only selected energy-efficiency projects will be reviewed.
The Existing Compressed Air Installation
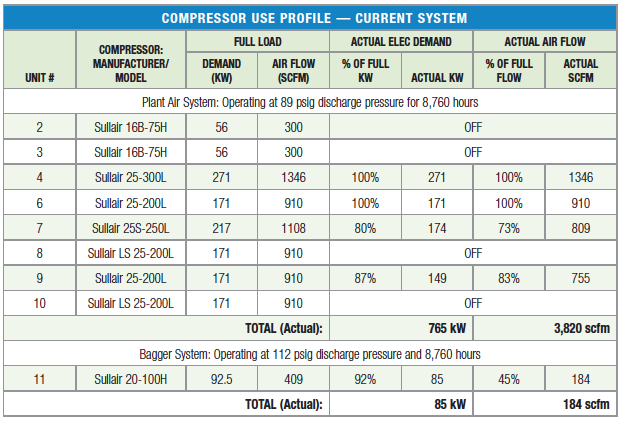
There are two main air systems in the facility, the plant air and the bagger air systems. There are a total of nine compressors in the plant to supply compressed air to the end users. Eight compressors are for the main plant air system and one compressor is dedicated to the Bagger system and camera cooling.
The plant air system consists of eight, single-stage, lubricated, Sullair rotary screw compressors. All units are in good working order. Units 2, 3, 4 and 7 are water-cooled and units 6, 8, 9, 10 and 11 are air-cooled. The main plant air system has two primary compressed air dryers, a Thompson Gordon model TG 2000 refrigerated dryer, and a Sullair model SAR 1350 heatless desiccant dryer. Both units are working according to their design. The TG 2000 uses approximately 11.2 kW and is a non-cycling type unit, and the SAR 1350 uses approximately 200 cfm of purge air to regenerate the wet tower.
The Bagger system has a Sullair 20-100H producing 409 scfm at 115 psig discharge pressure. This unit is also in good working order. This system is tied into the main system in case of shut down or for maintenance. The dryer for part of the Bagger system uses a CompAir model AP 380 heatless desiccant dryer consuming 45 cfm for regeneration of the wet tower.
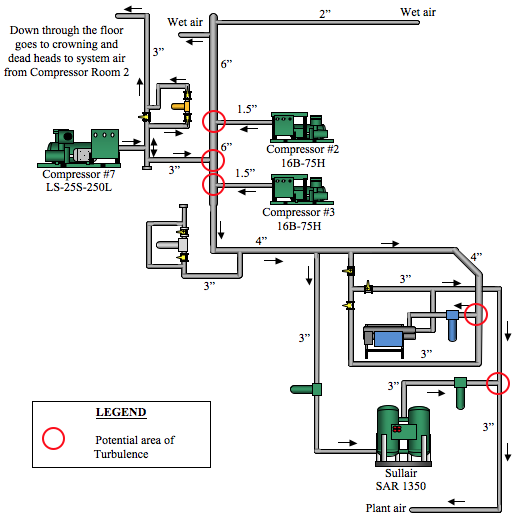
The air compressors are located in basically two rooms. Compressor room #1 has Units 2 and 3, with 7 outside the wall connected to the 6” header in the room. Compressor room #2 has Units 4, 6, 8, 9, 10, and outside is compressor 11 feeding the Bagger line and camera cooling.
Main End Users of Compressed Air
One significant end user of compressed air is the Bagger on Line 3, operating the large cylinders for filling the bags with loose material. Not all of the air for the Bagger is dried meaning saturated and oily compressed air is going into this process. This system also supplies the Crown Blowing camera coolers allowing operation personnel to monitor the process.
The Blowing Crown air, which is regulated down to between 40 and 60 psig, is fed from the main plant air system. According to plant personnel, each Crown blow uses 280 to 340 cfm, with a total of nine for the three production lines. There are also seven atomizers for each Crown Blowing on Lines 1 and 2, using 45 to 70 cfm each at 25 to 45 psig.
The other main user is the raw material transport system, which according to plant personnel uses between 700 to 800 cfm for up to six minutes for each transport session. This system is regulated down to 45 psig from the main plant air system. Plant personnel are interested in separating the Crown blow and the transport air system air off of the main plant air system. For this report we will identify the cost savings of running dedicated low-pressure systems for these two identified high use demands.
Figure 1. Current Compressed Air System-Compressor Room #1
Establishing the Energy Baseline
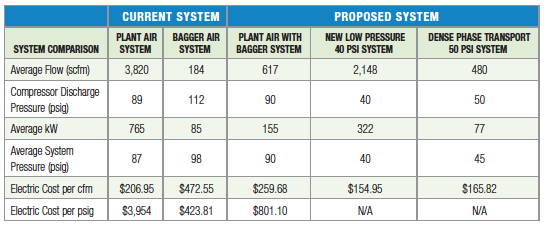
Annual plant electric costs for compressed air production, as operating today, are \$878,628 per year. If the electric costs of \$11,577 associated with operating ancillary equipment such as dryers are included the total electric costs for operating the air system are \$890,205 per year. These estimates are based upon a blended electric rate of \$0.118 /kWh.
The system assessment focused on air-flow reduction opportunities, installing a separate, dedicated low-pressure air system to supply the Crown Blowing air, and to supply the Bagger from the main plant air system.
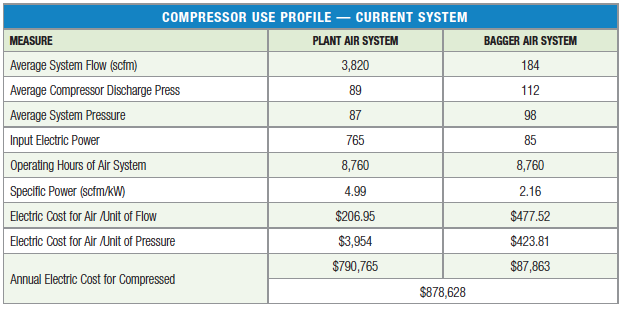
*Based upon on a blended electric rate of \$0.118 per kWh and 8,760 hours/year.
Air Flow Reduction Projects
The system assessment revealed air flow reduction projects totaling 750 cfm. The projects included replacing timer drains with zero air-loss condensate drains (36 cfm), replacing open blows with Venturi nozzles (370 cfm), repairing identified air leaks (106 cfm), and replacing heatless desiccant air dryers with a refrigerated air dryer (247 cfm). Due to article space constraints, we will only show the detail on the Venturi nozzle project.
We replaced high pressure air blow offs with Venturi nozzles as listed below. It’s a “best practice” to use Venturi air amplifier nozzles whenever and wherever possible – properly selected and applied for needed thrust and volume, this will usually reduce blow-off air at least 50%, freeing up more air flow for other more valuable applications.
| Number of blow offs | 98 |
| Estimated high pressure air used currently | 590 cfm |
| Estimated high pressure air used after installation of Venturi nozzles | 220 cfm |
| Value of air reduction | \$215.18/cfm yr |
| Total electrical energy cost recovery by installing Venturi nozzles to reduce blow | \$79,618/yr |
| Cost of nozzles and installation (\$35 per nozzle plus \$65 per installation) | \$10,000 |
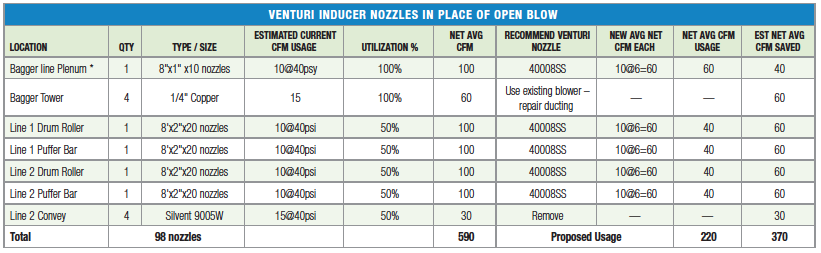
*Estimated could not see inside to view nozzles.
Note: there are several Guard Air Force 5 blow guns located in the plant. These blow guns use 185 cfm at 90 psig.
The Crown Blowing System
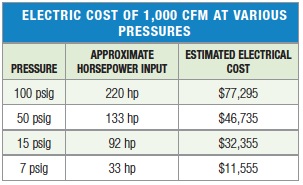
In this manufacturing operation, a significant volume of 100 psi compressed air is being regulated down to the 40 psi application of the crown blowing system. This is a savings opportunity. In general terms, let’s take a look a what is the relative electrical energy cost to produce 1,000 cfm of compressed air at various pressures (based on .05 kWh, 8,760 hrs/year, and .93 ME).
According to plant personnel, each Blowing Crown uses 280 to 340 scfm. Air Power calculates average of 310 with six Crowns - as running during our site visit equals 1,860 scfm. An additional 57 scfm average for four atomizers running on Line 2 for a demand of 228 and 20 scfm for the three atomizers running on Line 1 is 60 scfm for a total of 288 scfm for the atomizers would be a total low pressure demand average of 2,148 scfm. This demand is subtracted from the current Plant system demand with the Bagger system added to it, subtracting the 45 scfm from the dryer purge leaving 1,794 scfm left on the Plant air system.
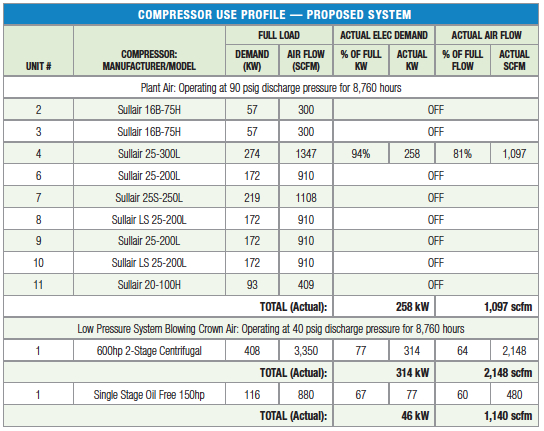
The system assessment recommended installing one 600 horsepower, 2-stage, water-cooled, low pressure centrifugal to supply the Crown Blowing system with 40 psig air. The centrifugal will come equipped with inlet guide vanes for efficient turn down. This unit produces 3,350 scfm at 40 psig and 3,150 scfm at 60 psig. The plant can use the current 100 psi system as emergency back-up. The piping to the Blowing Crown will have to be modified to carry the air demand at 40 psig with little or no pressure loss from the compressor to the Crowns.
| Annual hours of operation for current system | 8,760 hrs |
| Annual energy cost of current system after air reductions and combining Bagger System with Plant Air System | $680,161/yr |
| Annual energy cost of proposed system | $591,265 /year |
| Annual energy savings | $88,896 /year |
| Estimated equipment cost for new unit / modifications | $200,000 |
| Estimated installation cost | $150,000 |
| Estimated total project cost | $350,000 |
Pneumatic Conveying Application
The current application is using the main plant air system to provide the transport air for the raw material. There are three different transporters: mixed material to feed furnace, glass powder and minor ingredient. According to plant personnel the transport system consumes between 700 to 800 scfm for around six minutes for mixed material per transport and operates approximately 60% of the time. This equates to a 480 scfm average demand on the system. The glass powder transport operates two to three hours per day while the minor ingredient operates the same time frame as mixed material.
The configuration and transport demands are:
| Worst Case product bulk density | 1.20 MT/m3 |
| Length of Run 150 feet | 150 feet |
| Number of Elbows | 5 x 90° Elbows … pocket elbow, short radius |
| Line Size | 4" #80 Black Pipe |
| Convey Rate | 400-600 lbs. per minute |
The transport system has a very detrimental effect on the main plant air system, when it operates it draws the plant system air pressure to unacceptable levels. The plant air is regulated down from plant pressure to 45 psig at the transport system feed.
The system was set up for dense phase transport and over the years has been converted to dilute phase. On a typical dilute phase system with the maximum pressure being 15 PSI, running at 14 PSI doesn’t allow any room to account for pressure spikes or other possible upset conditions. Most systems run at no higher than 12 PSI, allowing 3 PSI to account for the spikes and other unforeseeable issues.
Ideally, it would be best to change the system to a 6” line, and then the following could be accomplished:
400 PPM in a 6” line = approximately 1135 CFM at 6.9 PSI
500 PPM in a 6” line = approximately 1140 CFM at 8.2 PSI
600 PPM in a 6” line = approximately 1150 CFM at 9.5 PSI
We nevertheless recommend returning the system back to Dense Phase with a dedicated low pressure (50 psi) compressor to replace the high-pressure plant air now being used. We recommend installing a 150 horsepower oil-free rotary screw compressor to provide the 800 scfm peak flow to properly operate the transport system
Conclusion
This system assessment case study is interesting in that many plants use 100 psi compressed air and regulate it down for applications ranging in the 15 to 40 psi range. Particularly plants deploying dilute or dense phase transport systems need to take a good look at the energy efficiency of their supply-side compressed air system. This plant was able to realize \$321,000 in yearly energy savings by identifying this opportunity.
For more information visit, Air Power USA.
To read more System Assessment articles, visit www.blowervacuumbestpractices.com/system-assessments.