Positive Displacement (PD) blowers have been a workhorse for wastewater treatment for over 150 years. They are robust and simple to operate. They are often the first choice for small facilities and for applications with wide variations in discharge pressure. When combined with variable frequency drives (VFDs) they provide operational flexibility in flowrate across a wide range of discharge pressures.
The performance of PD blowers may be provided as tabulated data or in a performance curve. Regardless of format, the data is provided based on specific inlet and discharge conditions. Whether designing a new system or evaluating an existing one, the design engineer frequently needs to evaluate performance at conditions that differ from those provided in the available data.
There are simple calculation methods available for extrapolating the performance of a PD blower from one set of operating conditions to another. These methods provide sufficient accuracy for most design and evaluation purposes. The accuracy achieved will be better than the ±4% applied to most published data. However, for establishing and evaluating power guarantees or other purposes requiring high levels of accuracy the manufacturer should be consulted. If precise values are needed the rigorous evaluations provided in codes such as ASME PTC 13 should be used.
Basic Performance of PD Blowers
Wastewater applications for PD blowers are dominated by two basic types. Both are available as bare blowers, but current applications favor complete packages with accessories like filters, silencers, VFDs, and controls preassembled in a sound attenuating enclosure.
The lobe type blower, sometimes referred to as a “Roots type blower”, has two counter-rotating shafts with identical two or three lobed impellers on each. Air flow is around the periphery of the impeller and perpendicular to the shafts. Peak efficiency occurs at the maximum rpm. [See Figure 1.]
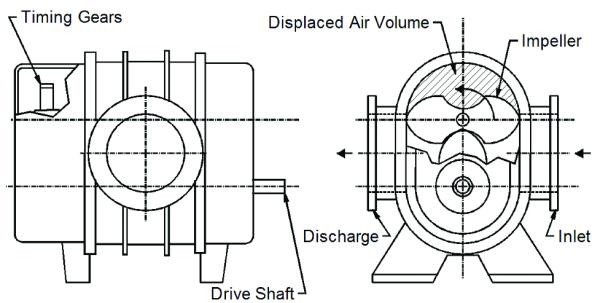
Figure 1: Example of a Lobe Type PD Blower.
The screw type blower also has two rotors, each consisting of a counter-rotating shaft with an impeller. One impeller is male and the other female, and each has a different number of lobes. The configuration of the impellers establishes a fixed volume ratio as the air flows axially from inlet to discharge. The peak efficiency usually occurs at reduced speed and when the pressure ratio matches the volume ratio of the impellers. [See Figure 2.]
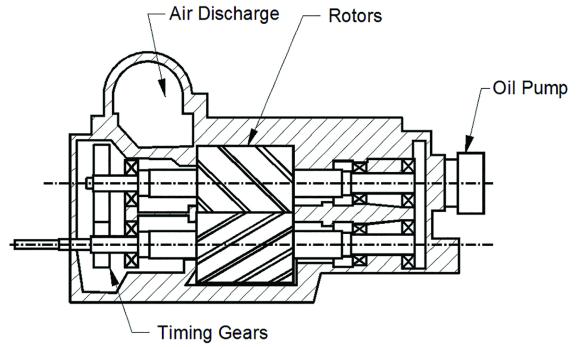
Figure 2: Example of a Screw Type PD Blower.
Both types of PD blowers have similar performance characteristics:
- Airflow rate proportional to speed: A fixed volume of air is moved from inlet to discharge with every rotation. Changing the volumetric flow rate requires changing speed.
- Variable discharge pressure: The pressure at the blower discharge will inherently rise to the level required to push the displaced volume into the system.
- Proportional power: Power at the blower shaft is a function of the pressure difference across the blower and the air flowrate.
- Linear performance: For a fixed pressure differential the relationship of power to air flow can be expressed in a linear equation using the form y = mx + b. Note that the intercept is typically non-zero. [ See Figure 3.]
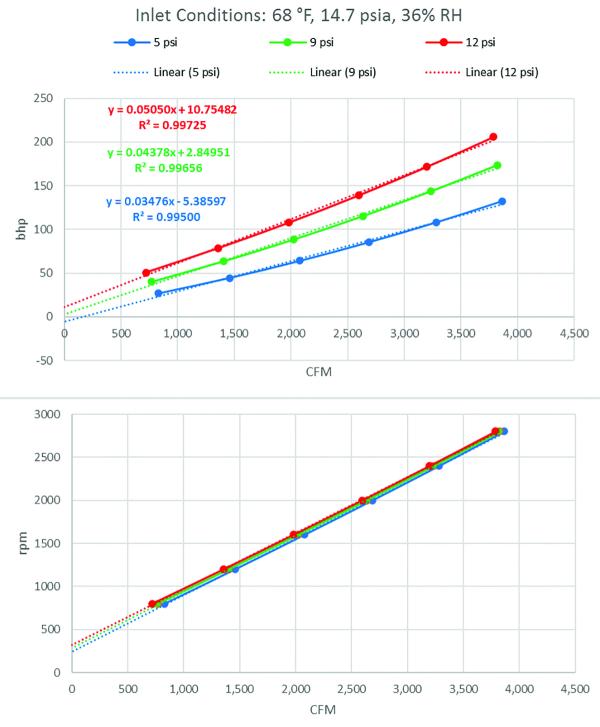
Figure 3: Example Screw Blower Performance.
The performance characteristics may be provided as a family of curves. [See Figure 3.] It is also common for performance data to be tabulated. [See Figure 4.]
|
6 |
psi |
10 |
psi |
12 |
psi | |
|
rpm |
cfm |
bhp |
cfm |
bhp |
cfm |
bhp |
|
1160 |
3156 |
104 |
3028 |
166 |
2974 |
198 |
|
1460 |
4086 |
137 |
3958 |
216 |
3904 |
256 |
| Performance at inlet conditions of 68 °F, 14.7 psia, 36% RH | ||||||
Figure 4: Example of Tabulated Performance Data.
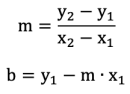
A linear equation can be readily obtained from as few as two data points by using a spreadsheet chart function and adding a trendline. Expanding trend parameters to four significant figures is suggested.
Alternatively the slope and intercept can be obtained from the data using standard algebraic methods.
The provided data is only correct for the specific inlet and discharge conditions indicated. It is rare that these conditions meet the application’s needs. Linear extrapolation methods are applicable to both types of PD blower.
Pressure
System discharge pressure is important for two reasons. It establishes the motor torque and power needed. It also affects the required rotational speed, since the internal leakage of air from discharge back to inlet, known as slip, increases slightly as differential pressure across the blower increases.
Tabulated data and performance plots usually include data for several different discharge pressures. Linear interpolation should use two pressures that bracket the required pressure. Two sets of interpolation are necessary:
- Interpolate flow as a function of pressure at two different speeds
- Interpolate power as a function of pressure at two different speeds
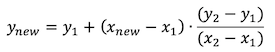
The general formula for linear interpolation is:
The power and flow rate are based on the pressure differential across the blower. The new differential pressure used in extrapolations must include allowances for inlet losses from filters, silencers, and piping.
The power given is typically the brake horsepower (bhp) at the blower drive shaft. Calculations for electrical power consumption must include considerations of belt drive efficiency as well as motor and VFD efficiencies.
Flow Rate
There are two aspects of airflow rate that require compensation. First is establishing the volumetric flow rate that corresponds to the process demand. Second is establishing the blower speed that will provide the necessary airflow.
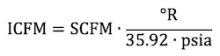
In some processes, such as channel aeration, the process demand is based on volumetric flow rate. For most wastewater processes the demand for air is based on delivering a required amount of oxygen. In this case the process demand is usually given as standard cubic feet per minute (SCFM). In the wastewater industry standard conditions are 68 °F, 14.7 psia, and 36% RH. To apply the process demand to the PD blower’s performance it is necessary to convert SCFM to the equivalent volumetric flow rate at the actual blower inlet conditions, inlet cfm (ICFM).
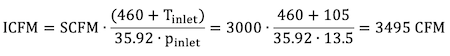
Ignoring relative humidity, the conversion from SCFM to inlet volumetric flowrate is straight forward:
Power
The power demand of a PD blower is comprised of several components. In addition to the power required for compression there are the losses resulting from mechanical friction of gears and bearings. Internal leakage increases power demand because some of the air compressed at the discharge flows back to the inlet side of the impellers. Screw blowers may have additional losses if the actual pressure ratio across the blower is lower than the internal pressure ratio conforming to the change in volume through the impellers. By extrapolating power demand from reported data the losses are accounted for without the need to identify specific sources of inefficiency.
The motor torque required for PD blowers of either type is proportional to pressure differential. For a given inlet and discharge pressure the motor amperage is nearly constant. Since heating of the motor is proportional to I2 the motor temperature increase may limit blower turndown and will affect VFD sizing.
Blower internal temperature increase rises with higher differential pressure and lower efficiency. At reduced speed excess blower temperature may occur, which often limits turndown. For lobe type PD blowers the turndown is limited to approximately 50%. For screw type PD blowers the turndown may be 60% or more. During final design the turndown limits should be verified with suppliers.
Example
An example based on the tabulated data in Figure 4 will illustrate the procedure.
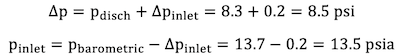
Assume the process demand is 3,000 SCFM and the required discharge pressure is 8.3 psig. Barometric pressure is 13.7 psia and inlet losses are 0.2 psi. The ambient temperature at worst case design conditions is 105 °F.
The first step is to determine the required differential pressure and actual pressure at the blower inlet:
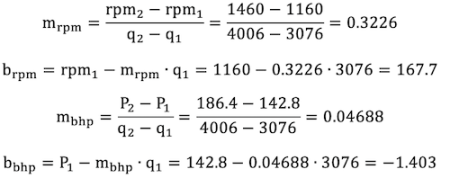
The next step is to extrapolate the tabulated performance data for airflow rate and power to the required pressure at each speed. For the first speed, 1160 rpm, the result is:
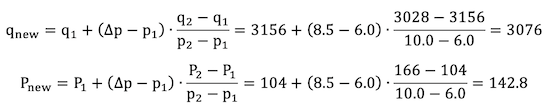
The calculation is repeated using values from the second speed, 1460 rpm and the results tabulated:
|
Performance at 8.5 psi Δp, 68 °F, 14.7 psia |
||
|
Blower shaft rpm |
ICFM |
bhp |
|
1160 |
3076 |
142.8 |
|
1460 |
4006 |
186.4 |
This data can also be used to create performance curves at the required inlet conditions. [See Figure 5.]
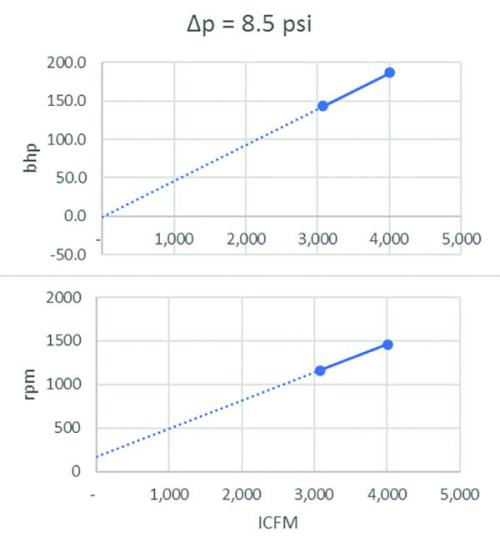
Figure 5: Performance Curve for Example Problem.
The next step is to develop the linear equations for speed and power vs. inlet airflow rate:
The process demand, SCFM, must be converted to the equivalent ICFM based on the ratios of absolute temperature and absolute pressure to standard conditions:
The blower speed and the power demand at the blower shaft can be calculated:
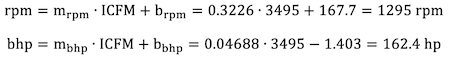
This is the speed and power needed to provide the required air flow at the actual inlet and discharge conditions. If the performance is needed at alternate flows with the same inlet conditions and discharge pressure the equation for performance is unchanged. The alternate SCFM can be converted to ICFM, and the speed and power calculated for the alternate flow rate.
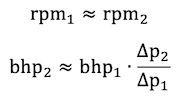
If the change in pressure differential at two evaluation points is small, approximately 1 psi or less, it is not necessary to develop new equations. Pressure differential does not have a major effect on the relationship between flow and speed. The change in power demand is proportional to the ratio of pressure differential at the two points:
Summary
The PD blower is the most appropriate technology for many wastewater applications. Published or submittal performance data typically does not reflect actual operating conditions. Energy evaluations and preliminary design often require evaluating performance quickly at a variety of conditions. Simple linear equations may be developed to extrapolate provided data to new conditions. This allows evaluation of the blower’s performance at actual application conditions with accuracy that exceeds most needs.
About the Author
Tom Jenkins has over forty years’ experience in blowers and blower applications. As an inventor and entrepreneur, he has pioneered many innovations in aeration and blower control. He is an Adjunct Professor at the University of Wisconsin, Madison. Tom is the current Chair of the ASME PTC 13 Committee. For more information, visit www.jentechinc.com.
To read similar articles on Aeration Blower Technology, please visit
https://www.blowervacuumbestpractices.com/technology/aeration-blowers.
Visit our Webinar Archives to listen to expert presentations on Aeration Blower Systems at https://www.blowervacuumbestpractices.com/magazine/webinars.